Reporting & Controlling
Transparent evaluations and real-time overviews. They support the analysis of company data, promote data-based decisions and improve the management of processes and resources.


Data Analysis
The system collects and evaluates company data from various sources. Key figures are calculated to make performance, costs and processes visible. In this way, trends can be identified, weaknesses identified and well-founded decisions can be made that improve efficiency and profitability.
Report Creation
Individual reports are generated automatically and can be flexibly adapted to various requirements. The reports support the management of business areas, promote transparency and regularly provide decision makers with up-to-date information on planning and control.
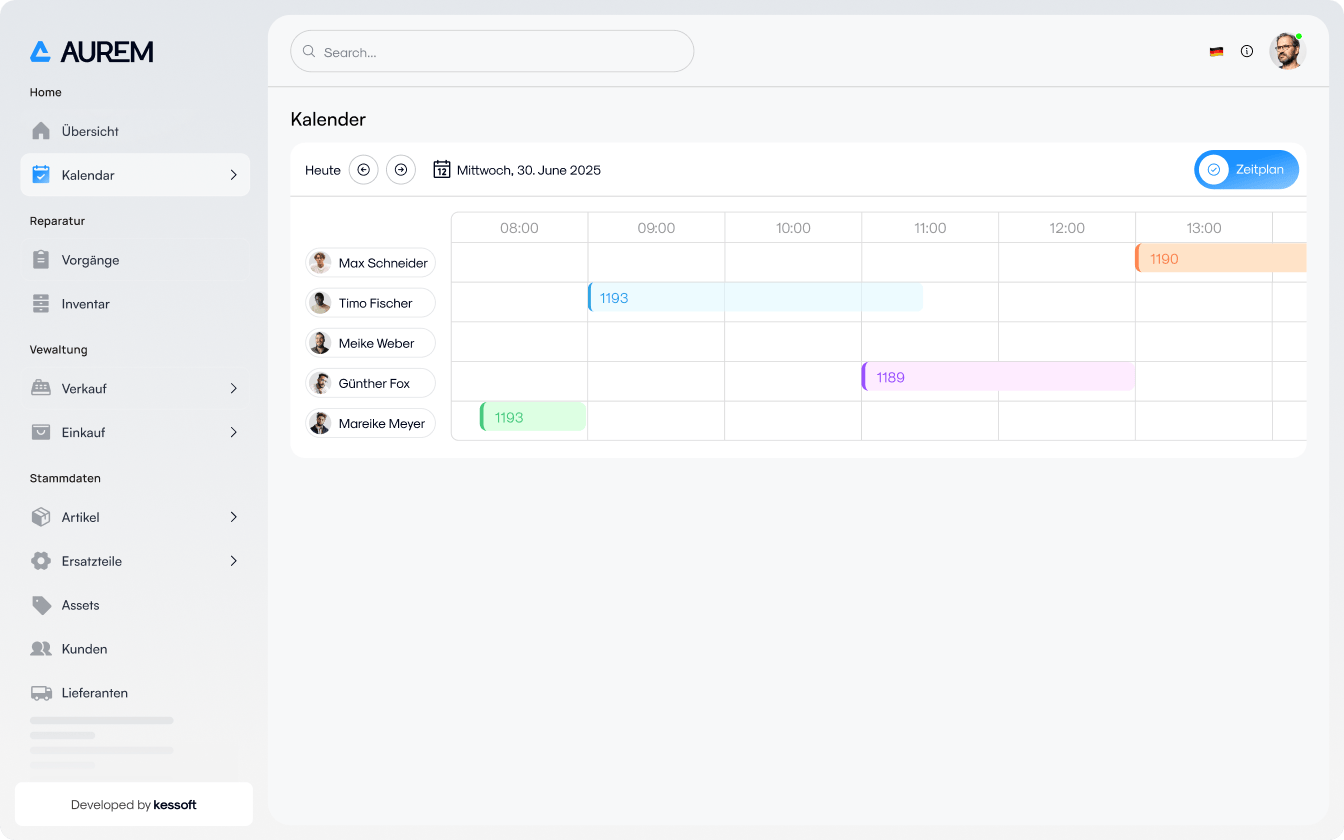
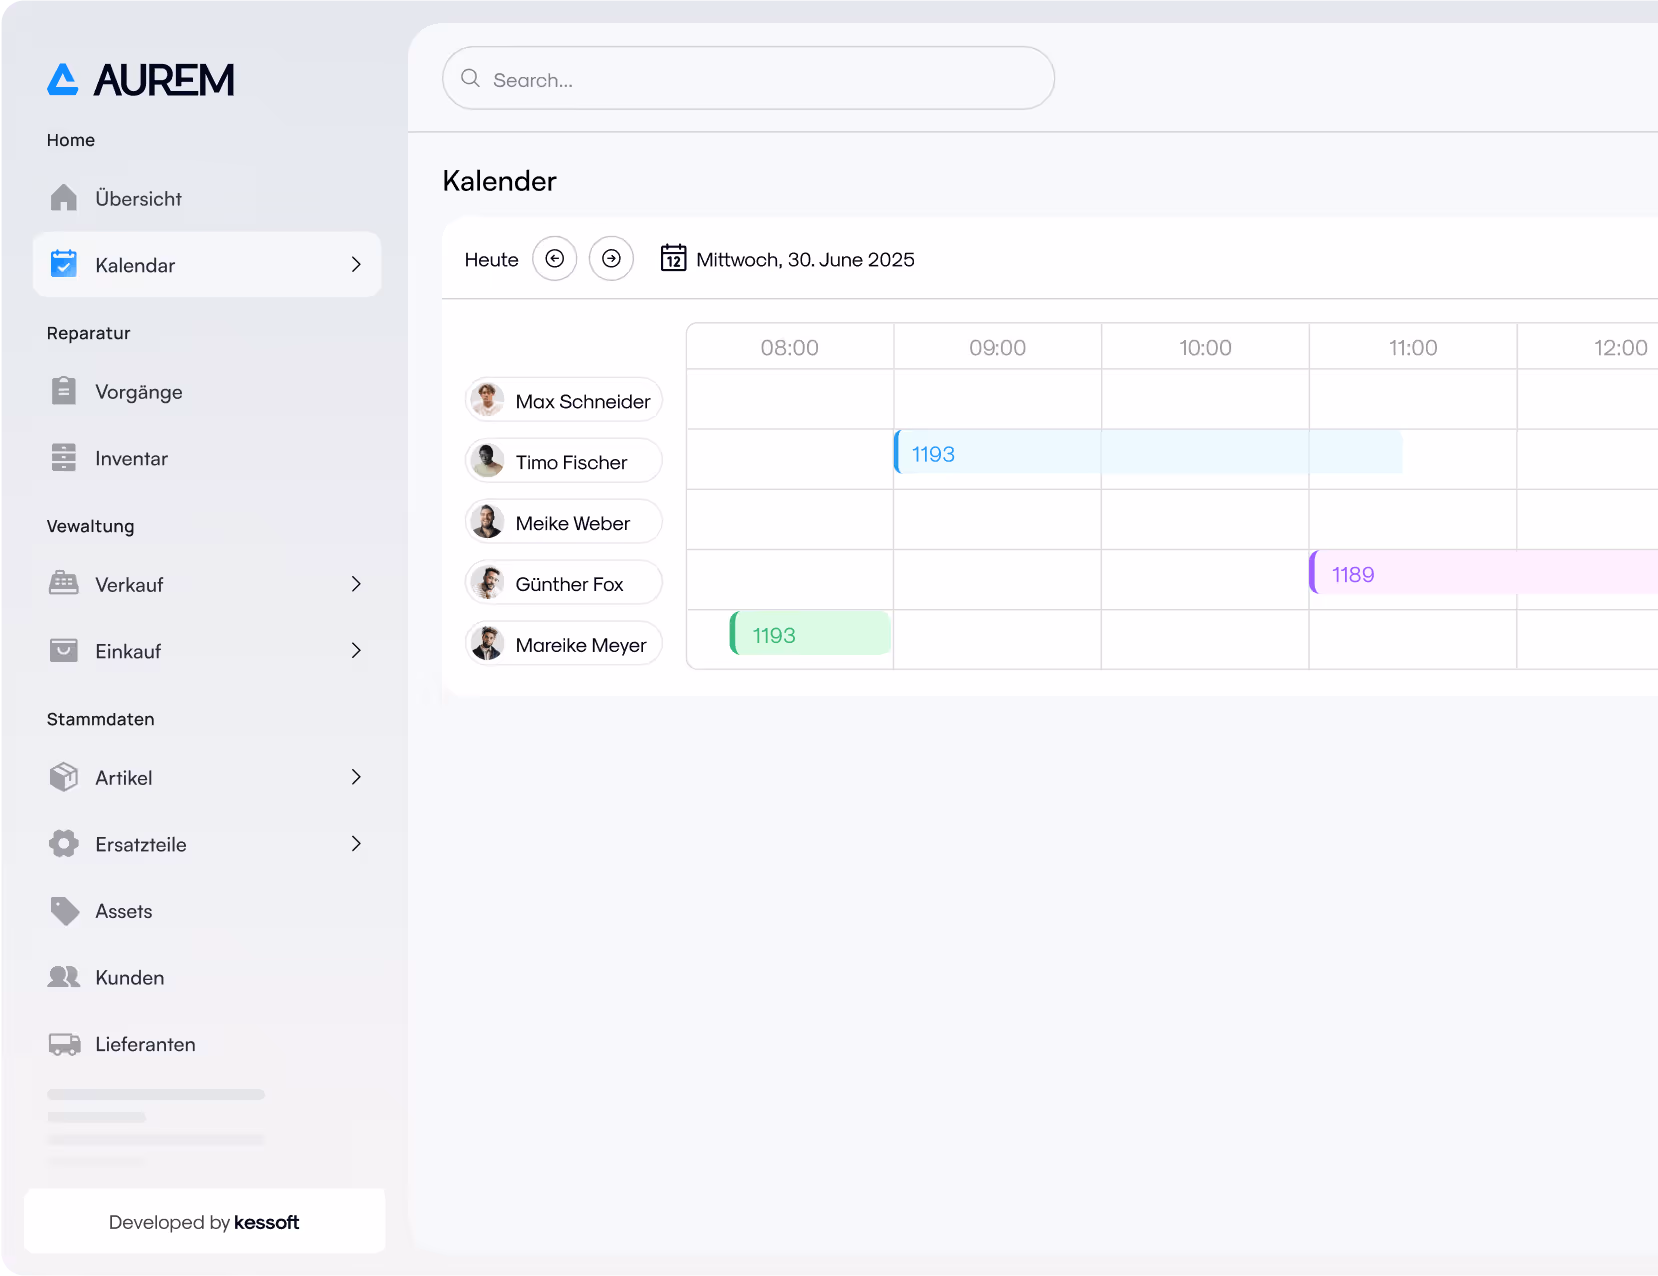
Interactive Dashboards
Dashboards provide a visual, interactive presentation of real-time data. Users can filter data, adopt different perspectives, and quickly identify trends. This makes it easier to monitor key figures and promotes proactive action in real time.
Notification System
The system continuously monitors defined thresholds and key figures. In the event of deviations or critical events, alarms are automatically triggered. This allows managers to react quickly, minimize risks and ensure business continuity.
More Features

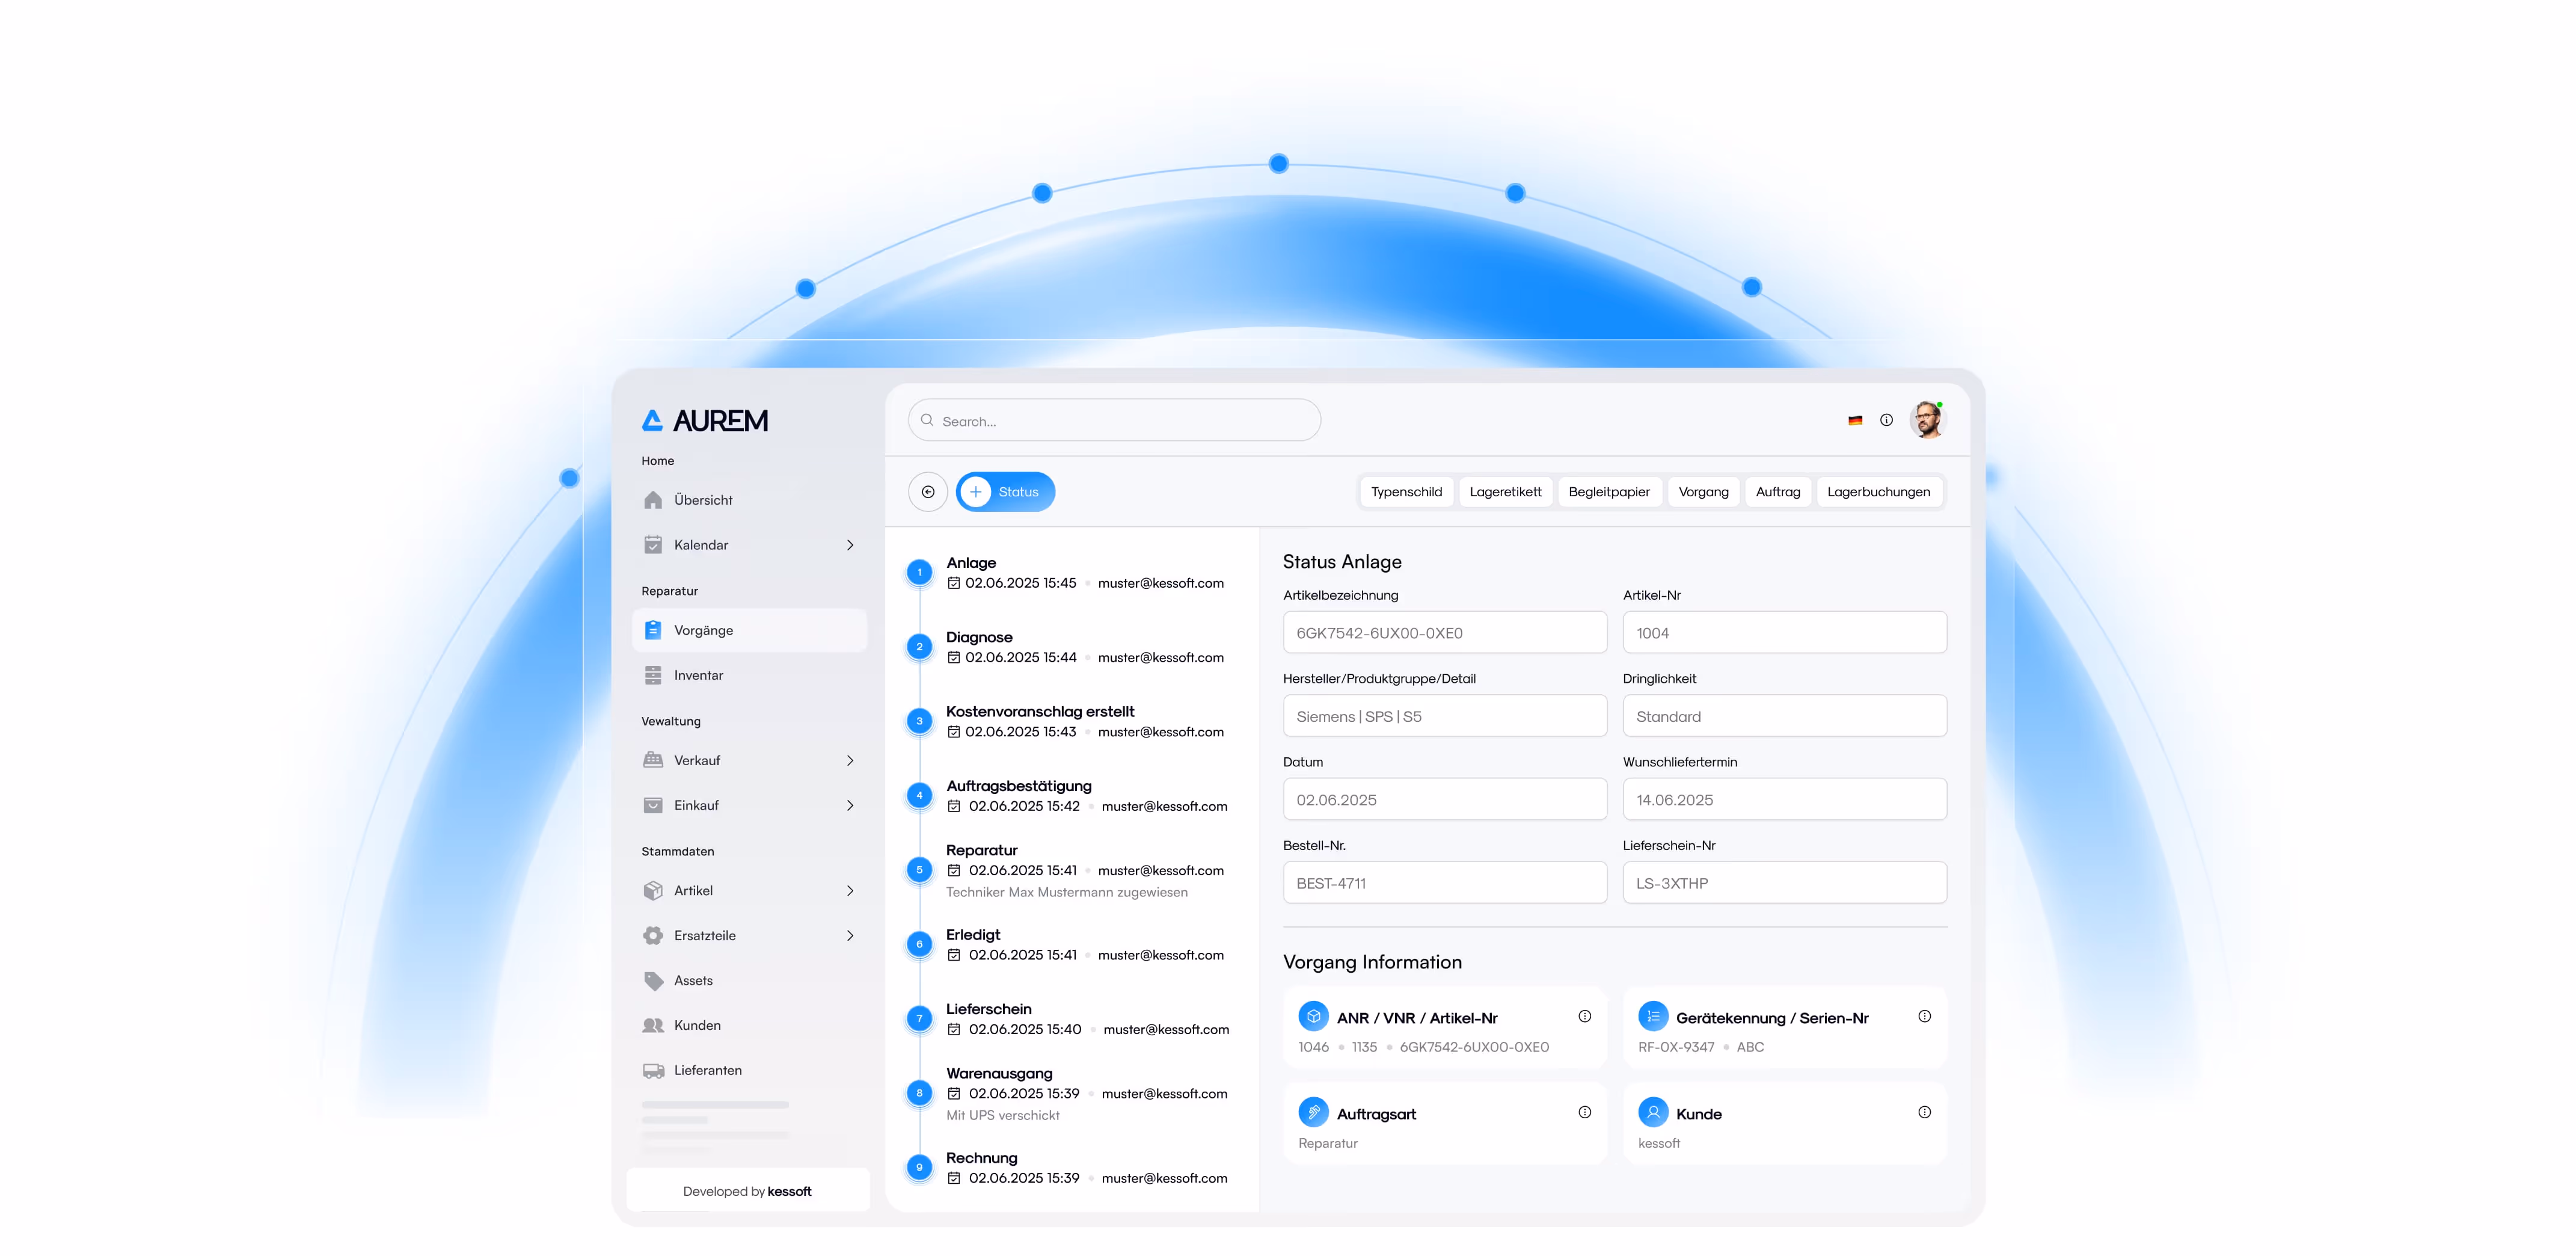
Flexibles Statusmanagement und Historie
Passen Sie den Reparaturstatus mühelos an und verfolgen Sie ihn. Führen Sie eine vollständige Änderungshistorie, um vollständige Transparenz, effiziente Arbeitsabläufe und eine klare Prozessverantwortung zu gewährleisten.
Verkaufsdokumente
Generieren und verwalten Sie alle Verkaufsdokumente — einschließlich Angebote, Auftragsbestätigungen, Rechnungen und Lieferscheine — direkt aus Ihren Bestellungen für optimierte und fehlerfreie Verkaufsprozesse.
Inventarverwaltung
Verwalten Sie Ihr Inventar ganz einfach mit Echtzeit-Tracking, Standortüberwachung und Lagerwarnungen, um eine optimale Verfügbarkeit und einen optimierten Lagerbetrieb zu gewährleisten.